Flutter 맛보기 1
직방 기술지원팀 기술공유 세미나 중 플러터를 소개한 내용입니다
직방 기술지원팀 기술공유 세미나 중 D3.js를 소개한 내용입니다
D3 is not a monolithic framework that seeks to provide every conceivable feature. Instead, D3 solves the crux of the problem: efficient manipulation of documents based on data
D3는 생각할 수 있는 모든 기능을 제공하려는 모놀리식 프레임워크가 아닙니다. 대신 D3는 문제의 핵심인 데이터 기반 문서의 효율적인 조작을 해결합니다.
- D3 문서 중에서 -
chart.js, billboard.js 등의 데이터와 옵션을 조절하여 그래프를 그리는 라이브러리와 달리 svg, canvas를 data와 함께 다루기 쉽게 도와주는 저수준 라이브러리.
billboard.js (d3 base)를 사용할 경우
  <!-- Markup -->
  <div id="lineChart"></div>

  <!-- JS -->
  var chart = bb.generate({
    data: {
      columns: [
  			["data1", 30, 200, 100, 400, 150, 250],
      ],
      type: "line",
    },
    bindto: "#lineChart"
  });
d3.js 를 사용할 경우
  function LineChart(data, {
    x = ([x]) => x, // given d in data, returns the (temporal) x-value
    y = ([, y]) => y, // given d in data, returns the (quantitative) y-value
    defined, // for gaps in data
    curve = d3.curveLinear, // method of interpolation between points
    marginTop = 20, // top margin, in pixels
    marginRight = 30, // right margin, in pixels
    marginBottom = 30, // bottom margin, in pixels
    marginLeft = 40, // left margin, in pixels
    width = 640, // outer width, in pixels
    height = 400, // outer height, in pixels
    xType = d3.scaleUtc, // the x-scale type
    xDomain, // [xmin, xmax]
    xRange = [marginLeft, width - marginRight], // [left, right]
    yType = d3.scaleLinear, // the y-scale type
    yDomain, // [ymin, ymax]
    yRange = [height - marginBottom, marginTop], // [bottom, top]
    yFormat, // a format specifier string for the y-axis
    yLabel, // a label for the y-axis
    color = "currentColor", // stroke color of line
    strokeLinecap = "round", // stroke line cap of the line
    strokeLinejoin = "round", // stroke line join of the line
    strokeWidth = 1.5, // stroke width of line, in pixels
    strokeOpacity = 1, // stroke opacity of line
  } = {}) {
    // Compute values.
    const X = d3.map(data, x);
    const Y = d3.map(data, y);
    const I = d3.range(X.length);
    if (defined === undefined) defined = (d, i) => !isNaN(X[i]) && !isNaN(Y[i]);
    const D = d3.map(data, defined);

    // Compute default domains.
    if (xDomain === undefined) xDomain = d3.extent(X);
    if (yDomain === undefined) yDomain = [0, d3.max(Y)];

    // Construct scales and axes.
    const xScale = xType(xDomain, xRange);
    const yScale = yType(yDomain, yRange);
    const xAxis = d3.axisBottom(xScale).ticks(width / 80).tickSizeOuter(0);
    const yAxis = d3.axisLeft(yScale).ticks(height / 40, yFormat);

    // Construct a line generator.
    const line = d3.line()
        .defined(i => D[i])
        .curve(curve)
        .x(i => xScale(X[i]))
        .y(i => yScale(Y[i]));

    const svg = d3.create("svg")
        .attr("width", width)
        .attr("height", height)
        .attr("viewBox", [0, 0, width, height])
        .attr("style", "max-width: 100%; height: auto; height: intrinsic;");

    svg.append("g")
        .attr("transform", `translate(0,${height - marginBottom})`)
        .call(xAxis);

    svg.append("g")
        .attr("transform", `translate(${marginLeft},0)`)
        .call(yAxis)
        .call(g => g.select(".domain").remove())
        .call(g => g.selectAll(".tick line").clone()
            .attr("x2", width - marginLeft - marginRight)
            .attr("stroke-opacity", 0.1))
        .call(g => g.append("text")
            .attr("x", -marginLeft)
            .attr("y", 10)
            .attr("fill", "currentColor")
            .attr("text-anchor", "start")
            .text(yLabel));

    svg.append("path")
        .attr("fill", "none")
        .attr("stroke", color)
        .attr("stroke-width", strokeWidth)
        .attr("stroke-linecap", strokeLinecap)
        .attr("stroke-linejoin", strokeLinejoin)
        .attr("stroke-opacity", strokeOpacity)
        .attr("d", line(I));

    return svg.node();
  }
생산성이 중요. 유지보수 비용 줄여야 한다 → 차트 라이브러리
데이터를 차별화해서 보여줘야한다. (커스텀이 중요) → d3로 직접 만들어야 함.
이 데이터로
const data = [
  {name: "🍊", count: 21},
  {name: "🍇", count: 13},
  {name: "🍏", count: 8},
  {name: "🍌", count: 5},
  {name: "🍐", count: 3},
  {name: "🍋", count: 2},
  {name: "🍎", count: 1},
  {name: "🍉", count: 1}
]
bar 차트를 만들어 보자

d3의 selection 문법은 jquery 문법과 비슷. 가장 기본이 되는 svg 태그를 추가.
<!-- HTML -->
<div id="chart"></div>

<!-- JS -->
const svg = d3
  .select('#chart')
  .append('svg')
  .attr('viewBox', `0 0 ${width + (margin.left + margin.right)} ${height + (margin.top + margin.bottom)}`)
  .attr('width', width)
  .attr('height', height);
g 태그는 주로 transform 으로 children elements를 그룹핑하여 한꺼번에 사용할 때 많이씀. (transform 속성)
const group = svg
  .append('g')
  .attr('transform', `translate(${margin.left} ${margin.top})`);
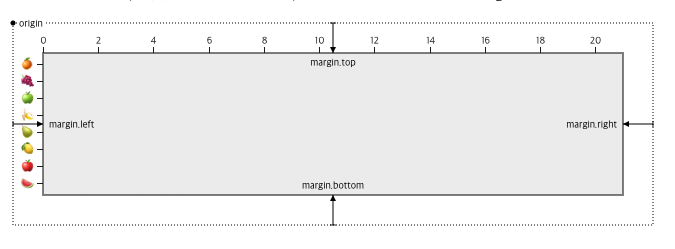
x축, y축 을 viewBox 안으로 밀어 넣기 위해 margin 값 설정
d3.scaleBand : 카테고리형 (name : 🍊, 🍇, 🍏, 🍌, 🍐, 🍋, 🍎, 🍉)
  const yScale = d3
    .scaleBand()
    .domain(data.map(({ name }) => name)) // 🍊, 🍇, 🍏, 🍌, 🍐, 🍋, 🍎, 🍉
    .range([0, height])
    .padding(0.2);

  const yAxis = d3
    .axisLeft(yScale); // d3가 제공하는 쉽게 축을 그려주는 함수

  // 예시
  yScale(🍊) :  12.439024390243873
  yScale(🍇) :  74.63414634146339
  yScale(🍏) :  136.8292682926829
  yScale(🍌) :  199.02439024390245
  yScale(🍐) :  261.219512195122
  yScale(🍋) :  323.4146341463414
  yScale(🍎) :  385.609756097561
  yScale(🍉) :  447.80487804878055
d3.scaleLinear : 선형 (count : 21, 13, 8, 5, 3, 2, 1, 1)
  const xScale = d3
    .scaleLinear()
    .domain([0, d3.max(data, ({ count }) => count)]) // 21, 13, 8, 5, 3, 2, 1, 1
    .range([0, width]);

  const xAxis = d3
    .axisBottom(xScale); // d3가 제공하는 쉽게 축을 그려주는 함수

  // 예시
  xScale(21) :  680
  xScale(13) :  420.95238095238096
  xScale(8) :  259.04761904761904
  xScale(5) :  161.9047619047619
  xScale(3) :  97.14285714285714
  xScale(2) :  64.76190476190476
  xScale(1) :  32.38095238095238
const groups = group
  .selectAll('g.group') // group 클래스를 가진 g 태그들을 전부 선택.
  .data(data) // data 매서드로 selection 객체에 데이터를 바인딩.
  .enter() // 만약 g.group 엘리먼트가 없을 경우 새로운 g.group을 반환하도록 설정.
  .append('g') // 없는 엘리먼트를 채워 넣음.
  .attr('class', 'group')
  .attr('transform', ({ name }) => `translate(0 ${yScale(name)})`) // data로 맵핑한 요소들을 iterating 하며 값을 설정.

groups
  .append('rect')
  .attr('x', 0)
  .attr('y', 0)
  .attr('width', ({ count }) => xScale(count))
  .attr('height', yScale.bandwidth())
  .style('fill', '#6994C0');
d3는 존재하지 않는 요소들을 선택(.selectAll())하고 바인드(.data(), .enter())하는 경우가 많음.
이는 데이터를 기반으로 엘리먼트를 동적으로 만들기 때문에 가상으로 selection 객체를 만들고 그 객체로 dom 요소를 조작(생성/수정/삭제)하기 때문.

👉 selection 객체 동작을 잘 설명해주는 블로그 링크
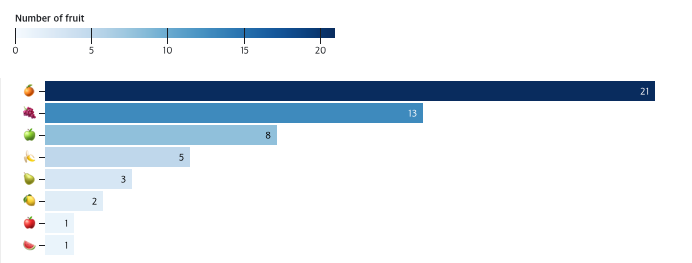
데이터의 통계 값 등을 추출해낼 때 유용한 연산 매서드들을 제공
  d3.extent([3, 2, 1, 1, 6, 2, 4])
  // [1, 6]
이 밖에도 지도 데이터를 표현하기 위한 polygon 데이터들도 다루기 편하게 제공하는 함수들도 많음. d3-geo, d3-geo-projection, d3-polygon
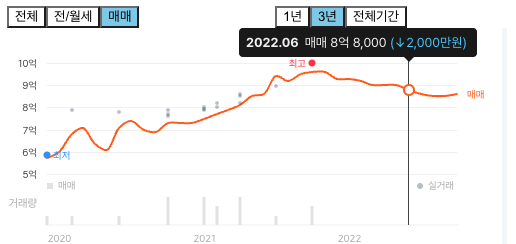
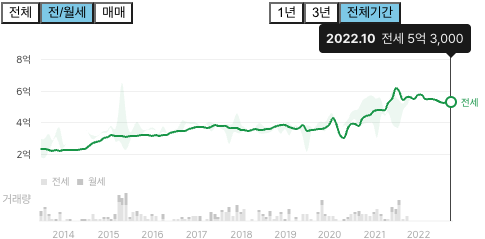
다른 프로젝트의 차트를 마이그레이션 & 커스텀. 다수의 리팩토링 작업 진행.
필터에 따라 여러 차트들을 인터렉티브하게 조합해서 표현해야 했음.
d3 쓰면서 느낀점:
d3 개발자 Mike Bostock는 다양한 예시들의 코드를 보며 감을 잡고 문서를 찾아보는 방식의 공부를 추천
직방 기술지원팀 기술공유 세미나 중 플러터를 소개한 내용입니다
직방 기술지원팀 기술공유 세미나 중 D3.js를 소개한 내용입니다
직방에서 작성했던 블로그 글을 공유합니다.
회사에서 프론트엔드 개발원칙을 SFC(Single File Component)에서 UI 컴포넌트를 기준으로 CDD(Component Driven Development)를 진행하려고 한다. 그래서 체계적으로 관리하기위해 Storybook과 Bit을 도입해보고자 한다. 각각의 역할은 ...
작성 배경 회사의 작업구조를 페이지 중심 개발에서 UI 컴포넌트 중심 개발로 변경하면서 Workflow를 개선할만한 환경을 구성해야했다. 폐쇄망 기반에서 개발자간 UI 명세서 역할을 할 수 있는 Storybook과 그것을 공유할 Verdaccio라는 구축형 NPM Pri...
Git 시스템 이해하기
CDD(Component Driven Development)란?
GraphQL? RESTful?
회사 프로젝트를 작업하기 전 프론트엔드 개발자들 간의 코드 규칙을 Eslint와 Prettier 설정을 맞춰 관리해가는 방향을 정했다. 아직 협업을 할 경우는 없지만 미래에 인수인계 받거나 협업을 진행할 경우 코드관습이 달라 고생할 경우를 대비하기로 했다. 설정은 작업을 진행하며 ...
공부겸 코딩테스트 사이트에서 토요일 오전 10시에 백엔드 포지션 테스트를 해준다기에 참여해봤다. SQL문제가 나왔는데 더 좋은 답이 있는것 같아 나중에 기록해두고 수정해보기로 한다.
WebRTC란?
동적 프로그래밍(Dynamic Programming)
알고리즘 공부를 하며 부족했던 개념을 다시 정리
문제 : 피보나치 수열 제 1항부터 입력한 자연수(N)까지의 피보나치 수열 항들의 합을 구하여라.
각 반복문의 용도
참고 5 ways to exclude your own visits from Google Analytics How to exclude your own [dynamic] ip from Google Analytics
문제1 문제를 알려줄 수 없다는 답변 받음. github에서 네이버 핵데이 검색하면 나옴.
문제3 문제를 알려줄 수 없다는 답변 받음. github에서 네이버 핵데이 검색하면 나옴.
오픈채팅방 문제 바로가기 링크 카카오의 설명 블로그 나의 첫답안 function solution(N, stages) { let st = stages, stats = []; for(let i=1;i<N+1;i++){ // n let selectedN...
chaning comparison 파이썬은 chaning comparison이라는 신기한 문법이 있다. 참고 if a < b and b < c : (...) 라는 구문이 if a < b < c : (...) 으로 연산된다. 직관적인 문법이 인상적. ...
문제 정수 배열이 주어지면 인덱스 i에 해당하는 값 이외의 모든 값들의 곱인 배열을 구하여라. 보너스 : 나눗셈을 안쓰고 풀기
Set vs Array - 관련기사 Set 유일값들의 배열이 필요할때(distinct) 집합의 개념이 필요할때(차집합, 교집합 등등 자체 메서드들이 많음.) index가 필요 없을때 Array에서 중복값을 없앨때 => ...
문제 list라는 행렬과 k라는 자연수가 주어짐. list의 두 값을 합하여 k값을 만들 수 있으면 true, 없으면 false를 리턴해라. 보너스 : 한줄 표기
문제 정수 배열(int array)가 주어지면 가장 큰 이어지는 원소들의 합을 구하시오. 단, 시간복잡도는 O(n).
<!– ## 설명 각 문자열의 알파벳을 재배열하였을때 같은 단어가 되는 단어들. 예시 tab - bat github - hbuitg
오픈채팅방 문제 바로가기 링크 카카오의 설명 블로그 나의 답안 ```javascript function solution(record) { let accounts = [], events = [], answer = []; function setEn...
문제 설명 별(*) 박스 만들기 입력값 a(rows)와 b(cols)에 해당하는 별박스 만들기
SGIS에서 받은 지도데이터(.shp)를 geojson으로 변경하는 작업 내용